| Part 2: 2001/02 FISCAL UPDATE | ||
|
Consistent with the government’s commitment to an accountable and open fiscal management environment, this fiscal update provides British Columbians with a current picture of provincial finances for the 2001/02 fiscal year. It is based on the budget presented to the Legislature on March 15, 2001, updated to reflect:
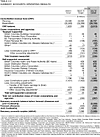
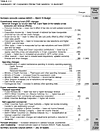
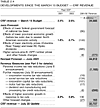
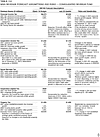
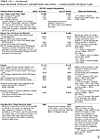
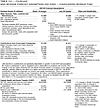
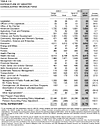
A full three-year plan for the period 2002/03 to 2004/05 will be presented to the Legislature on Tuesday, February 19, 2002. The summary accounts are now projected to show a $1.5-billion deficit in 2001/02. This compares to a $1.1-billion surplus that was forecast in the budget on March 15, 2001. Table 2.1 provides an overview of changes to the forecast since March. The updated forecast is presented in Table 2.2, and further details of changes are provided in Table 2.3.
Since March, the revenue forecast has been lowered $470 million to reflect an outlook for weaker electricity prices and the effect of slower economic growth in 2001, partially offset by the positive effect of tax cuts. The forecast incorporates the previously announced personal income tax rate reduction which provides taxpayers with benefits estimated at $1.15 billion in 2001/02, and further net tax reduction measures in the July 30 Update totalling $228 million. These measures are expected to have a positive stimulative effect on a number of revenue sources through increased economic activity. The spending forecast has increased $455 million since March to reflect a number of previously unfunded pressures and accounting changes. In addition, a number of other risks will need to be managed closely over the rest of the year to ensure that budget targets are achieved. The forecast for Crown corporations shows a $23-million improvement from the March forecast, primarily due to improvements in the finances of British Columbia Hydro and Power Authority (BC Hydro) and Forest Renewal BC. The one-time benefit of joint trusteeship was reduced $110 million, based on a revised estimate of pension plan liabilities prepared during the finalization of the 2000/01 Public Accounts. Joint trusteeship for the Teachers’ Pension and Municipal Superannuation plans was concluded on April 5, 2001. The summary accounts forecast allowance has been increased $200 million from the March 15 Budget to recognize more of the risks to the financial forecast over the rest of the year. The expenditure budget increase of $455 million also includes a $140-million increase in the Contingencies vote to help manage further spending risks.
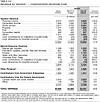
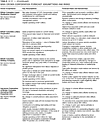
2001/02 Consolidated Revenue Fund Revenue At $22.7 billion, CRF revenue is projected to decline $1.3 billion or 5.5 per cent from the final result for 2000/01. The forecast is $1.8 billion or 7.5 per cent lower than the March 15 Budget in part due to a series of announced tax cuts intended to stimulate the economy as well as lower expected growth in the U.S. and lower energy prices (see Table 2.4). Details on main revenue sources are shown in Table 2.5 and in Supplementary Table 5. Key economic and other assumptions underlying the main sources in the 2001/02 revenue forecast are shown in Table 2.6. Personal income tax — down $1,135 million from the March forecast and 18 per cent lower than 2000/01 mainly due to the effect of announced tax rate reductions. The forecast incorporates the announced rate reductions on June 6, with an estimated value of $1,150 million. Although the reductions for the 2001 tax year were announced retroactive to January 1, 2001, the revenue forecast reflects a fifteen-month effect in the 2001/02 fiscal year as recommended by the Auditor General. The effect of the tax reduction is partially offset by a $20-million increase due to a reduction to the dividend tax credit rate, and by the recovery in forecast economic growth as a result of tax cuts (see Table 2.4). Corporation income tax — down $91 million from the March forecast but 9.5 per cent higher than 2000/01. The decline from March resulted from a lower federal government forecast of national corporate profits that will reduce instalments to the province over the rest of the year. The forecast incorporates the effect of a reduction to the general tax rate (13.5 per cent from 16.5 per cent effective January 1, 2002) which has an estimated value of $16 million in 2001/02. This is offset by a $20-million increase resulting from the elimination of the three-per-cent investment tax credit effective July 31, 2001. Lags in the tax collection system administered by the federal government mean that the provincial government will not reap the positive effects of these measures until future years. However, the benefits to British Columbians are expected to begin this year as new investment and job creation takes hold.
Social service tax — down $79 million from the March forecast, but up 1.3 per cent from last year. Elimination of the sales tax on production machinery and equipment and an increase to the threshold at which vehicles are subject to a higher tax rate (effective July 31, 2001) will reduce revenue by $134 million this year. This is partly offset by the expected positive effect of higher retail sales growth in response to the tax cuts. Corporation capital tax — $83 million below the March forecast and 24 per cent lower than 2000/01. The effect of phasing out the tax applied to non-financial corporations (starting September 1, 2001) will reduce revenue by $101 million in 2001/02. However, this is partly offset by the effect of larger-than-expected final assessments at the end of 2000/01 which increased the tax base. Fuel, property and other taxes — down $33 million from the March forecast but slightly higher than last year. Fuel tax revenue is $29 million lower than the March forecast due to the effect of tax reductions for jet, aviation and bunker fuels, which reduce revenue by $17 million this year, and a lower-than-assumed tax base at the end of 2000/01. The 6.1-per-cent decline in fuel tax revenue from 2000/01 also reflects a 1-cent-per-litre increase in revenue transferred to the Greater Vancouver Transportation Authority (TransLink).
Natural gas and petroleum royalties, permits, fees and minerals — unchanged from the March forecast and $34 million lower than last year as the high levels of Crown land drilling rights sales in 2000/01 are not expected to continue at the same pace in 2001/02. Forests — up $40 million from the March forecast and down slightly from 2000/01. Stumpage revenue is expected to be $29 million higher than the March forecast as the effects of an outlook for higher spruce-pine-fir (SPF) 2 x 4 prices and a lower exchange rate offset lower average hemlock prices and harvest volumes. Lumber export fees collected by the federal government for 2000/01 will be $28 million higher than the March forecast. This is partly offset by a lower forecast of logging tax revenue in 2001/02. Columbia River Treaty — $356 million below the March forecast and 25 per cent lower than 2000/01 due to the effect of lower assumed average market prices on sales of electricity received under the treaty. Electricity received under the treaty is sold on behalf of the government through Powerex, a subsidiary of BC Hydro, at market electricity prices. Since March, average monthly market electricity prices in the U.S. have fallen about 75 per cent. By contrast, net income of BC Hydro improved since the March forecast as the corporation was able to take advantage of the unexpectedly high volatility in the market during the first two months to increase its electricity trade margins (i.e. differences between purchase and selling prices). Other revenue — down $77 million from the March forecast and 1.9 per cent lower than last year. The budget revision reflects lower estimates of revenue from asset dispositions, Medical Services Plan premiums and Crown land sales. Crown corporation contributions — down $29 million from the March forecast due to a correction of the dividend estimate for BC Hydro used in the March forecast, partially offset by the effect of a higher net income forecast for 2001/02. Contributions from Crown corporations are 5.9 per cent lower than the previous year due to lower net income from BC Hydro and the Liquor Distribution Branch. Federal government contributions — $11 million lower than the March forecast due to lower Canada health and social transfer (CHST) contributions resulting from weaker national economic growth and a lower national tax base. Revenue Forecast Assumptions and Risks Changes to the revenue forecast can result from a combination of factors. These include changes in economic conditions, policy changes implemented mid-year, and other unpredictable events such as changing weather patterns, commodity prices, foreign trade restrictions and labour disruptions. Sometimes unrelated changes offset one another. For example, higher-than-expected energy resource revenue more than offset lower-than-forecast forest revenue in 2000/01. Table 2.6 compares the Ministry of Finance’s key economic and other assumptions for the main revenue sources in the March and July revenue forecasts for 2001/02. The table also provides estimated revenue sensitivities to changes in individual assumptions. 2001/02 Consolidated Revenue Fund Expenditure At $24.8 billion, CRF spending is $455 million higher than the March 15 Budget primarily to reflect a number of previously unfunded pressures and accounting changes. Chart 2.2 shows that total spending in 2001/02 is 12.1 per cent higher than the comparable 2000/01 budget estimate. This is due in part to the effect of $385 million of overspending that occurred in 2000/01 (carried over into 2001/02), based on Public Accounts information.
Table 2.7 provides an overview of changes to the spending forecast since the March 15 Budget. In 2000/01, the Auditor General recommended a pension accounting policy change that had the effect of reducing the government’s overall expenditure for the year. When this change is excluded from last year’s estimates, the underlying increase in budgeted program spending is $2.3 billion or 10.3 per cent in 2001/02 (see Table 2.8). Based on the actual results for 2000/01, comparative program spending shows an 8.4-per-cent increase in 2001/02.
Chart 2.3 shows the major components of the $2.3-billion increase in budgeted program spending for 2001/02. Of the total increase, health spending alone makes up nearly 50 per cent while education and social services account for 27 per cent. The following provides information on full-year spending budgets in 2001/02 compared to the 2000/01 comparative budget estimates (see Table 2.8). Where applicable, references are included at the end of each section and in the margins to highlight significant changes since the March 15 Budget. Legislation — up $6 million for increased costs related to an election year. Officers of the Legislature — up $25 million including $24 million for Elections B.C. Office of the Premier — up $5 million. The increase reflects a change since March and provides $3.5 million in funding for Crown Agencies Secretariat costs, which are no longer being directly recovered from Crown corporations. The budget also includes an increase of $1 million to support the new Premier’s Council on Technology, and to provide for the enhanced responsibilities of the government’s Chief Information Officer. The remaining increase is primarily to cover the cost of the Core Review and a number of other initiatives to improve the effectiveness of government. Ministry of Advanced Education — up $159 million. A 10.7-per-cent increase ($142 million) in educational institutions and organizations funding (including enhanced funding for Industry Training and Apprenticeship Commission programs) will provide: $47 million towards enhanced services for post-secondary students, including 5,025 new student spaces (including 400 new spaces for nurses), increased funding for the Technical University of British Columbia, and expanded training of health care workers under the Health Action Plan; $83 million towards increased funding support for core funding and cost increases of post-secondary institutions, including compensation for the tuition fee reduction, funding for previously contracted salary and benefit increases, and funding for anticipated contract settlements. The student financial assistance program budget will increase by $21 million or 16 per cent to fund anticipated increased demand, and amortization and debt service costs will decrease by $7 million. Since March, $13 million was added to the ministry’s budget for operating maintenance expenses that were previously classified as capital expenditures.
Ministry of Agriculture, Food and Fisheries — up $3 million mainly due to increased funding for Fisheries Renewal BC. Ministry of Attorney General — a $51-million budget increase includes an additional $18 million for payments to the McLeod Lake Indian Band for forestry stumpage revenue collected on their behalf, $19 million for increased claims against the government under the Crown Proceeding Act, $4 million for Air India proceedings, and additional funding for labour cost increases and other program enhancements. Since March, $14 million has been added to the budget including $9 million under the Crown Proceeding Act, $4 million for Air India proceedings and additional funding for justices of the peace and treaty settlements. Ministry of Children and Family Development — up $190 million. Services for children and families will increase $90 million and community living services for adults and special needs children will increase $60 million. The increases primarily reflect the costs of contract changes for community social service workers. Additional funding of $27 million is provided for early childhood development, approximately half of which is focused on the needs of aboriginal children. The budget includes $16 million for the implementation of an early intensive behavioural support program for autistic children. The ministry’s budget is essentially unchanged since the March 15 Budget. Ministry of Community, Aboriginal and Women’s Services — combines certain programs and services formerly provided by nine separate ministries. The increase of $91 million from the 2000/01 budget estimate includes:
partially offset by:
Ministry of Competition, Science and Enterprise — down $9 million primarily due to the conclusion of a number of time-limited agreements ($5 million), the elimination of Build BC Special Account disbursements in 2001/02 and reductions to both communications and strategic project funding. Ministry of Education — up $233 million. A 5.3-per-cent increase ($204 million) in transfers to public schools provides for capital maintenance; wage and benefit increases for all signed collective agreements; provision for anticipated settlements during 2001/02; funding for the Teachers’ Pension Plan Joint Trusteeship Agreement; and a $10-million contingency buffer if enrolment growth is higher than expected. The budget also maintains funding for reduced class sizes in Kindergarten to grade 3 (20 students in Kindergarten and 22 students in grades 1 to 3). The budget provides $21 million for increased amortization and debt service expenditures and an additional $7 million for independent schools. Since March, $64 million was added to the budget for operating maintenance expenses that were previously classified as capital expenditures. Ministry of Energy and Mines — up $30 million including the addition of $4 million for revenue-generating mineral, oil and gas initiatives, and increased payments required under the Vancouver Island Natural Gas Pipeline (VIGAS) agreement. The level of VIGAS payments is dependent upon prevailing natural gas prices. The increase in ministry expenditure is partially offset by lower program spending in other areas. Ministry of Finance — up $1 million mainly due to increased amortization costs for the corporate accounting system. Ministry of Forests — up $53 million mainly due to $55 million of additional funding for forest fire fighting that was added to the budget since March, partially offset by lower spending in other areas. Ministry of Health Planning — unchanged. This new ministry was created from components of the former Ministry of Health. Ministry of Health Services — up $1,101 million and includes $387 million in base budget increases related to the supplementary estimates received in 2000/01. Significant components are $53 million for rural physician recruitment and retention initiatives; $180 million for health authority service pressures and strategic initiatives under the BC Health Action Plan; and $67 million for improved access to hospital care, enhanced home support services and the BC Health Guide program. Notwithstanding the significant budget increase, some $400 million in potential spending pressures have been identified. Management strategies will be required to stay within the overall ministry budget. The Regional Programs’ budget (up $759 million) includes funding for a variety of negotiated and announced compensation provisions and payroll tax changes affecting health care workers, as well as other changes including:
The Medical Services Plan budget will increase $211 million to provide for the annualized costs of 2000/01 settlements with physicians in rural and small urban centres; demographic/utilization increases in physician services; and increased services by, and rate adjustments for, physicians paid through alternative funding arrangements such as service contracts. It also includes $19 million for new primary care initiatives, funded by the federal government, which was added to the budget since March. A $58-million lift in the Pharmacare budget is for utilization and price increases. This includes $45 million that was added to the ministry budget since March. A total of $70 million is provided for equipment; $29 million is included as part of government’s capital spending shown in Table 2.13, and $41 million is included in operating spending. Other increases in the Ministry of Health Services include an additional $41 million for amortization and debt servicing. An additional $7 million was added to the budget since March for Emergency Health Services’ compensation increases, which was offset by savings in amortization and debt servicing costs. In total, $143 million was added to the ministry’s budget since the March 15 Budget to recognize unfunded budget pressures. Ministry of Human Resources — up $73 million or 3.9 per cent. BC Benefits Programs will increase $70 million or 4.3 per cent. BC Benefits includes an additional $8 million for increased utilization in the child care subsidy program, $55 million for an increase in the disability benefits caseload, $20 million for the full-year cost of the flat rate earnings exemption, $10 million for increased costs in the health care and dental benefits program, $7 million for the full-year cost of the July 2000 two-per-cent BC Benefits rate increase, $6 million for disability-related new initiatives, and $9 million for other ministry pressures. The budget increases are partially offset by $35 million of savings resulting from a projected 4.7-per-cent-decline in the income assistance and Youth Works caseload and a $10-million reduction in labour market programs, of which $7 million occurred since March. Ministry of Management Services — up $12 million. Since March, $14 million was added to the budget to reflect additional funding of $5 million for a retirement allowance, which provides a lump sum payment of up to three months salary upon retirement for employees with more than 20 years of service. This accounting change is in response to a recommendation by the Auditor General that the government record its obligation for post-retirement benefits in its financial statements. Funding of $9 million was added to provide for increased severance settlement costs. The increase in ministry expenditures is partially offset by lower program spending in other areas. Ministry of Provincial Revenue — up $6 million mainly due to the cost of retroactive home owner grants. Ministry of Public Safety and Solicitor General — a $48-million budget increase includes $18 million for police services, $6 million for pre-trial facilities, and additional funding for labour cost increases and other program enhancements. The budget also includes an additional $9 million under the Emergency Program Act to better reflect historical expenditures in response to emergencies and disasters. Since March, $3 million has been added for wind-down costs related to the photo radar program. Ministry of Skills Development and Labour — up slightly due to government-wide salary and benefit increases. Ministry of Sustainable Resource Management — up $20 million including an additional $2 million to accelerate landscape-unit planning and $1 million for increased contributions to the Muskwa-Kechika Trust Fund. An additional $14 million was added since March, including $5 million for a contribution to the federal government for land purchases under the Pacific Marine Heritage Legacy (PMHL) agreement, and $9 million to accelerate the Central Coast Land and Resource Management Plan. The government will also provide a $20-million capital investment for the PMHL agreement. Ministry of Transportation — up $27 million. Net increases are predominantly due to the provision of a $34-million grant to the BC Transportation Financing Authority, which will be applied against the financing costs of capital road improvements. The increases are partially offset by a $23-million decrease in contributions to British Columbia Transit, resulting from a revised method of calculating the amortization of prepaid capital advances. Debt servicing and amortization costs of $15 million for the Rapid Transit 2000 Project are included in the budget because assets are now being brought into service. Ministry of Water, Land and Air Protection — up $47 million. This includes $4 million to initiate an action plan for protection of drinking water and to restore service levels. Additional adjustments have been made since March to recognize the province’s potential $45-million net cost for cleaning up the Britannia Mine, and for program reductions. Management of Public Funds and Debt (debt interest) — down $186 million due to the full-year impact of lower debt levels from the previous year, and lower interest rates on refinanced debt and floating-rate debt. Since March, the forecast has been reduced $17 million mainly due to lower-than-assumed interest rates and delayed borrowing. Although debt for government operating purposes is forecast to increase $2.1 billion by year-end, most of the borrowing will occur in the latter part of the fiscal year. As a result, the full impact on interest costs will be delayed until 2002/03. BC Family Bonus — down $32 million due to program changes to the federal National Child Benefit System. Effective July 1, 2001, the combined BC Family Bonus and the National Child Benefit Supplement increased to $1,332 from $1,260 per child per year. Changes were also made to the income threshold and rates at which benefits are reduced, resulting in more families receiving the maximum benefit. This resulted in a reduced requirement for provincial funding. Contingencies (All Ministries) and New Programs — up $255 million to reflect the larger spending budget and a number of spending risks in programs. Since March, $140 million was added to the budget to allow for a number of other potential costs that may occur over the rest of the year. Amortization of Change in Unfunded Pension Liability — $72 million lower primarily due to the effect of joint trusteeships introduced last year and in April for the major public sector pension plans. Other Appropriations — up $23 million mainly due to an increase for seismic mitigation costs for government buildings. Expenditure Assumptions and Sensitivities The main assumptions supporting the 2001/02 expenditure estimates are summarized in Table 2.9, together with a description of the major risks and sensitivities. Other Expenditure Assumptions and Risks Catastrophes and disasters: The expenditure budgets for the Ministries of Forests and Public Safety and Solicitor General include amounts to fight forest fires and other emergencies such as floods and blizzards. These amounts assume normal to moderate conditions and severity of costs. Although the overall expenditure budget includes a $360-million contingency vote in 2001/02, express provisions are not included for catastrophes or disasters beyond the amounts already identified in ministry budgets. Costs of such unforeseen events may also affect other ministry programs.
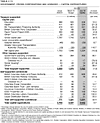
Pending litigation: The 2001/02 expenditure budget for the Ministry of Attorney General contains provisions for settlements under the Crown Proceeding Act based on estimates of expected claims and related costs of settlements likely to be incurred in 2001/02. Other litigation developments may occur that are beyond the assumptions used in the July 30 Update (such as potential costs for a Carrier Lumber Ltd. settlement or pending litigation related to disability Home Owner Grants), and may also affect expenditures in other ministries. The 2001/02 expenditure budget for the Ministry of Public Safety and Solicitor General contains provisions for settlements under the Criminal Injuries Compensation Act based on estimates of expected claims likely to be incurred in 2001/02. One-time write-downs and other adjustments: The 2001/02 expenditure budget does not assume or make allowance for extraordinary items other than the amount provided in the Contingencies Vote. Recoveries within ministry budgets: A number of ministry budgets assume that a portion of expenditures will be recovered from other agencies. The 2001/02 expenditure budget assumes that budgeted recoveries will be fully realized. Should recoveries be lower than budgeted, this could result in additional net expenditures. Since the March 15 Budget, the Contingencies (All Ministries) and New Programs Vote has been increased $140 million to allow for a number of potential costs that may occur over the rest of the year. In addition, the summary accounts forecast includes a $500-million forecast allowance for unforeseen developments during the rest of the year. This is $200 million higher than the March 15 Budget. Crown Corporations and Agencies In total, Crown corporations (after adjustments) are forecast to show a net loss to the summary accounts of $267 million in 2001/02, a $23-million improvement from the March 15 Budget. This compares to a combined net loss of $53 million in 2000/01 (see Table 2.2). Taxpayer-supported Crown Corporations and Agencies Combined net losses of taxpayer-supported Crown corporations and agencies (after adjustments) are projected at $333 million, up $20 million from the March 15 Budget. Operating losses totalling $124 million are $20 million higher than the March forecast. This reflects a $53-million expected loss for 552513 British Columbia Ltd. (Skeena Cellulose Inc.), partially offset by improvements in Forest Renewal BC and the British Columbia Buildings Corporation. Combined net losses (after adjustments) are $123 million higher than the final results for 2000/01. The increase primarily reflects larger losses in Forest Renewal BC and 552513 British Columbia Ltd. (Skeena Cellulose Inc.), lower net incomes of the British Columbia Buildings Corporation and the British Columbia Ferry Corporation, and the effect of one-time asset dispositions in other Crown corporations in 2000/01.
British Columbia Buildings Corporation — projected net income of $40 million is slightly higher than the March 15 Budget but $11 million lower than last year. The effect of lower gains from property sales and a 3.5-per-cent increase in operating costs will be partially offset by a 1.6-per-cent increase in operating revenue. The corporation expects to pay a $16-million dividend to the provincial government in 2001/02. British Columbia Ferry Corporation — estimated net income of $3 million is unchanged from March and $8 million lower than last year. Operating revenue will increase 1.6 per cent mainly due to a toll increase in February 2001, and increased motor fuel tax received from the provincial government. Operating expenses will increase 3.5 per cent, due to higher costs for pensions, training and safety initiatives, existing collective agreements, professional services and debt interest. These are partially offset by a reduction in amortization expense. BC Transportation Financing Authority — a projected break-even forecast compares to net income of $1 million in the 2000/01. Revenue will increase 8.2 per cent, largely due to a $44-million grant and increased dedicated taxes received from the provincial government. Expenditure will increase 8.4 per cent mainly due to higher debt interest costs (reflecting higher debt levels) and increased amortization. Forest Renewal BC — a projected net loss of $107 million is $32 million lower than the March forecast, but $43 million higher than last year due to lower stumpage revenue and investment income and a 3.1-per-cent increase in costs. The corporation will manage its projected deficit by accessing its program continuity reserve. 552513 British Columbia Ltd. (Skeena Cellulose Inc.) — a projected net loss of $53 million compares to the March 15 Budget forecast of $6 million net income. The change from March primarily reflects the impact of lower-than-assumed pulp prices. Due to an outlook for weak world pulp prices, and the expected effect on the finances of the company, 552513 British Columbia Ltd. has been reclassified from a self-supported to a taxpayer-supported Crown corporation. Other taxpayer-supported Crown corporations and agencies: combined net losses of $7 million are unchanged from the March forecast. This compares to combined net incomes of $49 million in 2000/01. The change from last year reflects the effect of a one-time $18-million gain from the sale of 577315 British Columbia Ltd.’s investment in Western Star Trucks Holding Ltd. in 2000/01, and lower net incomes in other Crown corporations in 2001/02. Self-supported Commercial Crown Corporations and Agencies The net contribution from self-supported commercial Crown corporations (after adjustments) is forecast at $66 million in 2001/02, up $43 million from the March 15 Budget forecast. Including BC Hydro’s rate stabilization account transfer, total operating income of $1.6 billion is up $14 million from the March forecast. Higher projected net income in BC Hydro is partially offset by lower net incomes of the Insurance Corporation of British Columbia (ICBC), British Columbia Railway Company and other Crown corporations. The rest of the improvement from the March forecast reflects a $29-million reduction in dividends paid to the CRF due to a re-estimate of BC Hydro dividends. Combined net contributions from self-supported commercial Crown corporations is $91 million lower than 2000/01. The decline from the previous year was mainly due to lower net incomes of BC Hydro (including rate stabilization account transfers), ICBC and the Liquor Distribution Branch, and lower accounting adjustments for differences in fiscal year-ends. British Columbia Hydro and Power Authority — net income is projected at $375 million (before rate stabilization account transfers). The forecast is $75 million higher than the March 15 Budget target mainly due to high electricity trade margins earned during the first two months of the fiscal year. A trade margin is generally the difference between the purchase and the selling price of electricity. The forecast assumes no change in domestic tariff rates. It incorporates the impact of recently announced price caps in the California energy market and assumes that a $45-million transfer will be required from the rate stabilization account in order to achieve BC Hydro’s regulated rate of return in 2001/02. BC Hydro was able to earn a larger-than-expected income during the first two months of the fiscal year as it was able to take advantage of the unexpectedly high volatility in the market to increase its trade margins. The recent introduction of price caps within the western region in mid-June 2001, has dampened the volatility in the market and as a result has reduced the margins BC Hydro is able to earn in the electricity trade market. The forecast of net income for 2001/02 is lower than the previous year largely due to the impact of low snowpack levels on reservoir inflows leading to the increased use of higher-cost energy purchases in comparison to hydro-generation. Lower electricity trade margins for the remainder of the year, largely due to price caps in the region, also contribute to the lower net income forecast compared to last year. Liquor Distribution Branch — projected net income of $616 million, unchanged from the March forecast and 4 per cent lower than 2000/01. The decline from last year mainly reflects a 2.3-per-cent increase in product and operating costs (due to amortized costs of a new retail management system), and additional costs relating to the shutdown of glass breakers and wage settlements and some one-time adjustments. British Columbia Lottery Corporation — net income of $585 million is unchanged from the March forecast and $23 million higher than 2000/01. Increased revenue from relocated casinos and increased lottery sales is partially offset by higher costs for prizes, commissions and operations. British Columbia Railway Company — a net income forecast of $1 million in 2001 is $17 million lower than the March forecast mainly due to an outlook for lower revenue from rail and container traffic. An $8-million improvement from the previous year largely reflects the effect of a one-time provision of $13 million in 2000 for anticipated environmental remediation costs. The corporation does not expect to pay a dividend to the provincial government in 2001/02. Insurance Corporation of British Columbia — a net income forecast of $35 million is $40 million lower than the March 15 Budget target. Net income is projected to be $104 million lower than in 2000 (after deducting road safety dividends). Re-estimates of the costs of settling previous years’ injury claims are not expected to result in the same level of significant savings as they did in 2000. This will result in an overall increase in claims costs but is partially offset by higher premium revenue due to increased sales. Other commercial Crown corporations and agencies: a combined net income forecast of $3 million is $4 million lower than the March forecast mainly due to a reclassification of 552513 British Columbia Ltd. (Skeena Cellulose Inc.) to a taxpayer-supported Crown corporation (the March forecast included a net income forecast of $6 million). Crown Corporations Forecast Assumptions and Risks The main assumptions supporting the forecasts are summarized in Table 2.11 together with a description of the material risks and sensitivities. Other Forecast Assumptions and Risks Crown corporations and agencies have provided their own forecasts which were used to prepare the summary accounts forecast for 2001/02, as well as the statement of assumptions and risks. The boards of those corporations and agencies have reviewed these forecasts. The July 30 Update for 2001/02 does not assume or make allowance for extraordinary adjustments other than those noted in the assumptions provided by the Crown corporations and agencies. Factors such as weather, electricity prices, fuel costs and accident trends could significantly change assumptions and resulting forecasts. The 2001/02 summary accounts forecast includes a $500-million forecast allowance for unforeseen developments affecting the government and its Crown corporations during the rest of the year. Provincial debt includes borrowing for schools, hospitals, transportation, utilities and other capital infrastructure projects. Capital spending for 2001/02 is estimated at $2.9 billion, down $134 million from the March 15 Budget. The decrease primarily reflects the reclassification of $154 million in maintenance costs previously budgeted as capital expenditures and now included in ministry operating budgets (primarily Health Services, Education and Advanced Education). An overview of this change is outlined in Table 2.12 and the adjustments in capital spending are reflected in Table 2.13. This reduction was partially offset by additional spending for minor capital purchases by government ministries and the delayed purchase of land for the future site of the Pacific National Exhibition (previously forecast to take place in 2000/01).
The government has undertaken a detailed review of its operating and capital spending to ensure that expenditures have been correctly classified in accordance with the government’s accounting policy. As a result, some capital maintenance expenditures were reclassified as operating expenses of ministries while some operating expenses were reclassified as capital expenditures. With the completion of the 2000/01 Public Accounts, $154 million of capital spending items in the March 15 Budget have been removed from the 2001/02 capital budget and added to ministry operating expense budgets consistent with the government’s accounting policies. Compared to 2000/01, capital expenditures will increase $104 million as higher capital spending by self-supported commercial Crown corporations (primarily BC Hydro) will be partially offset by reduced spending for taxpayer-supported capital projects (see Table 2.13). The capital spending amounts may be affected by various factors including:
As the financial impact of these risks is difficult to estimate, and because some risks are offsetting, a monetary value is not provided.
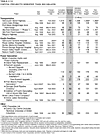
As required under the Budget Transparency and Accountability Act, significant capital projects with multi-year budgets totalling $50 million or more are shown in Table 2.14. The annual allocations of the full budget for these projects are included as part of the provincial government’s capital spending shown in Table 2.13. Total spending on these major projects in 2001/02 is estimated at $818 million, and the cumulative total at March 31, 2002 is forecast at $3.8 billion. As of March 31, 2001, $2.3 billion was spent over a number of years on major transportation capital projects including the Vancouver Island Highway and the SkyTrain extension. In 2001/02, a further $367 million will be spent on major transportation projects, with the largest share for SkyTrain. Cumulative spending on major health facilities will increase $102 million to total $257 million to the end of 2001/02, with significant spending for the Surrey Memorial Hospital and the Royal Jubilee Hospital in Victoria. The revised forecast for the completion of all major health facilities totals $640 million. Spending for power generation capital projects by the British Columbia Hydro and Power Authority and Arrow Lakes Power Company will increase $241 million to total $716 million by the end of 2001/02. These agencies are self-supported and the combined revised forecast for these projects is estimated at $1 billion. ICBC Properties Ltd. (a unit of the Insurance Corporation of British Columbia) will have invested $193 million by the end of 2001/02 on the acquisition and renovation of Surrey City Centre (including space for the Technical University of British Columbia). The total budget for the Surrey City Centre development is $253 million. Table 2.15 provides a partial list of the many projects occurring throughout the province in 2001/02. It contains projects moderate to large in size that are situated in various regions in the province and sponsored by various ministries and agencies.
2001/02 Provincial Debt 1 The government and its Crown corporations borrow to finance their operations (for example, when expenditures exceed revenues), to finance construction of capital projects or other investments, to refinance maturing debt and to finance working capital needs. Provincial debt is reported using two classifications:
Roughly $25 billion or 75 per cent of total provincial debt (excluding the warehouse borrowing program) reflects investments in capital assets — schools, hospitals, roads, transportation, utilities, and other forms of provincial infrastructure.
Total provincial debt is estimated to be $36.8 billion at March 31, 2002, or 28.2 per cent of provincial gross domestic product (GDP). This is $2.1 billion higher than the March 15 Budget and $2.9 billion higher than in 2000/01 (see Table 2.16). Taxpayer-supported debt will total $28.2 billion or 21.7 per cent of GDP by the end of 2001/02. This is $2.6 billion higher than the March 15 Budget forecast reflecting additional borrowing to finance the currently forecast summary accounts deficit and the reclassification of 552513 British Columbia Ltd. (Skeena Cellulose Inc.) debt from the self-supported category to taxpayer-supported. The increase is partially offset by lower balances for education and health facilities (due to the reclassification of certain capital expenditures as operating costs) and highways, ferries and public transit (due to lower-than- expected year-end balances at March 31, 2001). Self-supported debt will total $8.1 billion, $638 million lower than the March budget due to a lower debt forecast for BC Hydro and the reclassification of 552513 British Columbia Ltd. (Skeena Cellulose Inc.) debt as taxpayer-supported. The debt forecast includes a $500-million forecast allowance provision. This is $200 million higher than the March 15 Budget, consistent with the increase in the summary accounts forecast allowance. Although the July 30 Update does not present a three-year outlook, the recent review by the Fiscal Review Panel suggests that, based on preliminary fiscal forecasts for the next few years, it is likely that operating deficits will continue in the near term, requiring additional borrowing and an increase in government’s operating debt.
Chart 2.4 shows the expected change in total provincial debt in 2001/02. In total, provincial debt will increase $2.9 billion by year-end to finance working capital requirements and numerous capital projects of the government and its Crown corporations and agencies. Taxpayer-supported debt will increase $3.3 billion, commercial Crown corporation and agency debt will decrease $112 million and a borrowing allowance of $500 million is established to provide for unexpected developments in the government’s overall borrowing needs. These requirements will be met through new borrowing of $5.7 billion ($5.2 billion if the forecast allowance is not required) and a $712-million drawdown of previously borrowed funds held under the provincial warehouse borrowing program (see Table 2.17).
Borrowed funds will be used to finance the $1.5-billion deficit and maturing debt of $2.7 billion, and to partially finance capital expenditures of $2.9 billion and operating and working capital requirements of the consolidated revenue fund and Crown corporations and agencies. Some financial requirements (for example, certain commercial Crown corporation projects and portions of taxpayer-supported infrastructure projects) will be financed through internal sources such as net income of the British Columbia Hydro and Power Authority, and surplus cash balances at the end of 2000/01. Further information on provincial financing activities is provided in the topic box in this report. Details on the debt outstanding for the government, Crown corporations and agencies are provided in Supplementary Table 7.
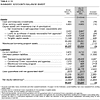
Summary Accounts Balance Sheet Table 2.18 summarizes the forecast changes in the province’s financial position during 2001/02. The table shows that:
will be financed by:
Further details are shown in Table 2.19
The government and its taxpayer-supported Crown corporations and agencies are projected to have a total staff utilization of approximately 44,100 full-time equivalents (FTEs) in the 2001/02 fiscal year. This includes 34,844 FTEs for ministries and special offices and 9,344 FTEs for taxpayer-supported Crown corporations and agencies. Since the March 15 Budget, there has been an increase of 70 FTEs for ministries and special offices and a decrease of 368 FTEs for Crown corporations and agencies. The decline in Crown corporations primarily reflects the removal of Highway Constructors Ltd. (HCL) employees from the utilization count, partially offset by the addition of Canadian Blood Services employees and various utilization increases in other Crown corporations. HCL employees have been removed from the FTE count because their costs are not paid directly through salaries, but are instead recovered from private-sector contractors. Utilization in ministries and special offices is projected to be 1,575 FTE’s higher than in 2000/01. The increase is due to planned under-utilization, reduced requirements for fighting forest fires and hiring recruitment lags in 2000/01, and additional resources that were provided in the March 15 Budget for new initiatives and service delivery pressures in children and families services, including before-and-after school child-care and justice programs in 2001/02. Taxpayer-supported Crown corporations and agencies show a 108-FTE increase from last year due to minor increases in the activity of several Crown corporations and agencies. Further details on staff utilization projections are available in Schedule G of the Estimates.
|
|||||||||||||||||||||||||||||||||||||||||||||||||||||||||||||||||||||||||||||||||||||||||||||||||||||||||||||||||||||||||||||||||||||||||||||||||||||||||||||||||||||||||||||||||||||||||||||||||||||||||||||||||


